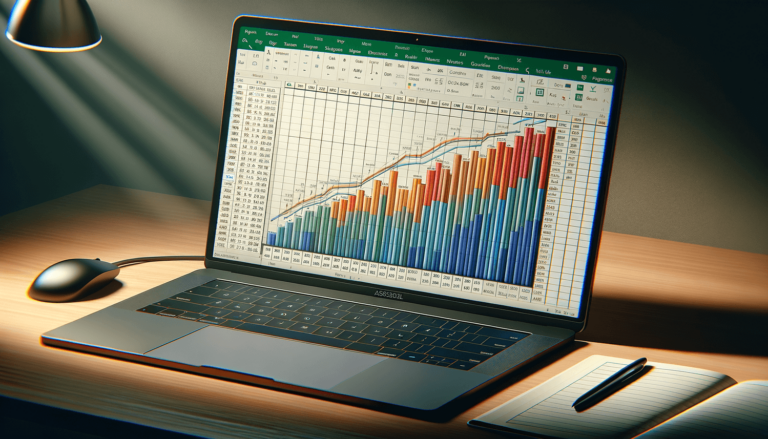

If you’re looking to create a project plan or track a project’s progress over time, a Gantt chart is an ideal way to visualize the schedule. Microsoft Excel is an excellent tool for creating Gantt charts, as it allows users to customize the chart to fit their specific needs and preferences. In this blog post, we’ll provide you with a step-by-step guide on how to create an Excel Gantt chart. Whether you’re a beginner or an experienced Excel user, you’ll find this guide to be a helpful resource in creating an informative and visually appealing Gantt chart in no time.
Before you create your Gantt chart, it’s important to understand the scope of your project and what tasks need to be completed. Identify the start and end dates of your project, and break it down into individual tasks.
Once you’ve identified the tasks and their corresponding dates, enter the data into Excel. You should have three columns: task, start date, and end date.
Select the Task column and the Start Date column, then create a stacked bar chart. This will create a single bar for each task that spans the duration of the project.
To add the duration of each task to the chart, right-click on the chart and select “Format Data Series.” Then, click on the “Options” tab and change the “Gap Width” to 0%. This will extend the bars to the end date of each task.
To add task names to the chart, right-click on the chart and select “Select Data.” Then, select the “Edit” button under “Horizontal (Category) Axis Labels.” Enter the range of cells that contain your task names.
Excel allows you to customize your Gantt chart to fit your specific needs. You can format the bars, change the font, and add colors to make the chart more visually appealing and informative.
A Gantt chart only works if it is clear and easy to understand. Here are some tips for creating a useful Gantt chart:
If you don’t want to create a Gantt chart from scratch, there are many Excel templates available online. These templates are pre-formatted and can be customized to fit your specific needs. Simply search for “Excel Gantt chart templates” and choose the one that works best for you.
Creating an Excel Gantt chart is a useful way to visualize a project’s timeline and track its progress. By following these steps, you can create a clear and informative chart that will help you stay on track and achieve your project’s goals.
Here are some frequently asked questions about creating an Excel Gantt chart:
All you need is Microsoft Excel. The process of creating a Gantt chart is straightforward and can be done using any version of Excel.
Gantt charts provide a visual representation of a project’s timeline and can help teams stay on track and meet their deadlines. They make it easier to identify scheduling conflicts and ensure that all tasks are completed on time.
Yes, you can easily update your Gantt chart if your project timeline changes. Simply adjust the start and end dates for each task in the chart, and Excel will automatically update the chart.
Yes, there are many Excel Gantt chart templates available online. These templates are pre-formatted and can be customized to fit your specific needs. Simply search for “Excel Gantt chart templates” and choose the one that works best for you.
You can make your Gantt chart more visually appealing by using colors to define different parts of the project, adding milestones to signify key dates or events, and using progress bars or a percentage complete to show how much of the project has been completed. You can also customize the font and formatting to fit your specific needs.
Explore the world of Microsoft PowerPoint with LearnPowerpoint.io, where we provide tailored tutorials and valuable tips to transform your presentation skills and clarify PowerPoint for enthusiasts and professionals alike.

Your ultimate guide to mastering Microsoft Word! Dive into our extensive collection of tutorials and tips designed to make Word simple and effective for users of all skill levels.

Boost your brand's online presence with Resultris Content Marketing Subscriptions. Enjoy high-quality, on-demand content marketing services to grow your business.
