How to Filter Multiple Columns in Excel
If you are working on a large dataset in Microsoft Excel, then filtering can help you quickly extract the data you need. Filtering is a powerful feature in Excel that allows you to view a subset of data based on certain criteria. However, if you are dealing with multiple columns at once, filtering can become overwhelming. In this blog post, we will show you how to filter multiple columns in Excel, so you can easily extract the information you need, without getting lost in the data.
Create a Table
The first step in filtering multiple columns in Excel is to create a table. A table in Excel is a collection of data organized in rows and columns. Tables are useful because they make it easy to sort and filter data without losing the context of the rows and columns. To create a table, simply select your data and press Ctrl+T. Make sure to check the “My table has headers” checkbox if your data has headers.
Select Multiple Columns to Filter
Once you have created your table, the next step is to select the multiple columns you want to filter. To select multiple columns, click and drag your mouse across the column headers. If the columns you want to filter are not next to each other, hold the Ctrl key while clicking on each column header you want to include in the filter.
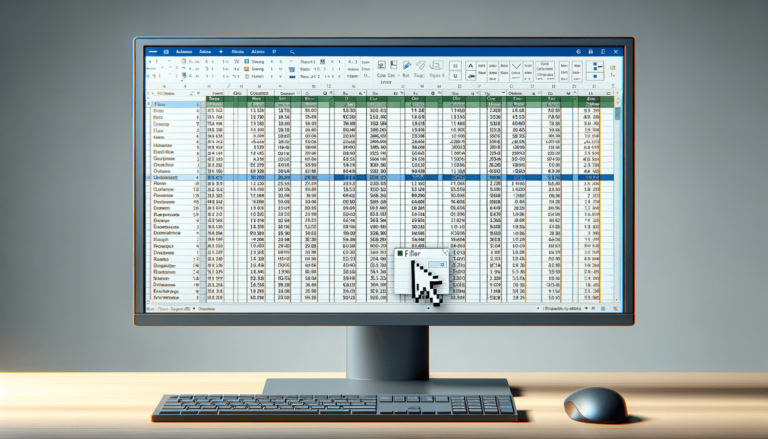
Apply the Filter
With your columns selected, you can now apply the filter. To do this, go to the “Data” tab in the Excel ribbon and click on the “Filter” button. You will see a small drop-down arrow appear next to each column header. Click on the arrow for the first column you want to filter and select the criteria you want to use to filter that column. Repeat this step for each additional column you want to filter.
Filter by Multiple Criteria
You can also filter by multiple criteria within the same column. To do this, click on the drop-down arrow for the column you want to filter and select “Filter by Color,” “Filter by Condition,” or “Text Filters.” These options allow you to filter by a combination of values, colors, or text within each column.
Clear the Filters
If you want to remove the filters and show all the data again, go back to the “Data” tab in the Excel ribbon and click on the “Clear” button. This will remove all the filters and restore your table to its original state.
Conclusion
Filtering multiple columns in Excel is a useful tool that can help you quickly extract the data you need from a large dataset. By creating a table, selecting multiple columns, applying the filter, and using multiple criteria, you can easily navigate and sort your data without losing important context. With these simple steps, you can filter your data like a pro in no time.
Using Advanced Filter
Another way to filter multiple columns in Excel is by using the advanced filter. This method can be useful if you want to filter your data based on complex criteria or if you want to save a filter for future use. To use advanced filter, you need to create a criteria range with your filtering criteria. Then, you select the data you want to filter and specify the criteria range in the advanced filter dialog box. This method can take a bit longer to set up, but it can be more customizable than the basic filter.
Hiding Columns Instead of Filtering
Sometimes you may want to hide certain columns in your dataset instead of filtering them. Hiding columns can be useful if you want to temporarily remove certain columns from view without deleting them from your dataset. To hide a column, right-click on the column header and select “Hide.” To unhide a column, go to the “Home” tab in the Excel ribbon, click on the “Format” button, and select “Unhide Columns” from the menu.
Sorting Your Data
Sorting your data can also be useful if you want to quickly find certain information within your dataset. To sort your data, select the column you want to sort by and click on the “Sort A to Z” or “Sort Z to A” button in the Excel ribbon. You can also sort your data by multiple columns by selecting multiple columns before clicking on the sort button.
Using PivotTables to Analyze Data
If you need to analyze large amounts of data, PivotTables can be a powerful tool. A PivotTable is a summary table that allows you to extract and analyze data from different angles. PivotTables can also be used to filter and sort your data based on multiple columns. To create a PivotTable, select your data, go to the “Insert” tab in the Excel ribbon, and click on the “PivotTable” button.
By following these tips and tricks, you can filter multiple columns in Excel like a pro. Whether you choose to use basic filters, advanced filters, or PivotTables, there are many ways to quickly extract and analyze data from your dataset. With practice, you can become an expert in filtering and sorting your data, making it easier to find and analyze the information you need.
FAQs
Here are some common questions that people ask about filtering multiple columns in Excel:
Can I filter multiple columns in Excel at the same time?
Yes, you can filter multiple columns at the same time by selecting the columns you want to filter before applying the filter. This can be useful if you want to extract data that meets certain criteria from multiple columns at once.
How do I use the advanced filter in Excel?
To use the advanced filter in Excel, you need to create a criteria range that specifies the filtering criteria you want to use. Then, you select the data you want to filter and specify the criteria range in the advanced filter dialog box. This method can be useful if you want to filter your data based on complex criteria or if you want to save a filter for future use.
How do I clear filters in Excel?
To clear filters in Excel, go to the “Data” tab in the Excel ribbon and click on the “Clear” button. This will remove all the filters and restore your table to its original state.
Can I sort my data in Excel?
Yes, you can sort your data in Excel by selecting the column you want to sort by and clicking on the “Sort A to Z” or “Sort Z to A” button in the Excel ribbon. You can also sort your data by multiple columns by selecting multiple columns before clicking on the sort button.
What are PivotTables and how can I use them to analyze data?
A PivotTable is a summary table that allows you to extract and analyze data from different angles. PivotTables can be used to filter and sort your data based on multiple columns. To create a PivotTable, select your data, go to the “Insert” tab in the Excel ribbon, and click on the “PivotTable” button. PivotTables can be very useful if you need to analyze large amounts of data or if you want to view your data in different ways.